Changes In percent profitable trades, 20-day CHBOC on Coffee
| >o o 10 o irt o io o io t- r- cm cm co ro ^t -a- Initial stop ($) |
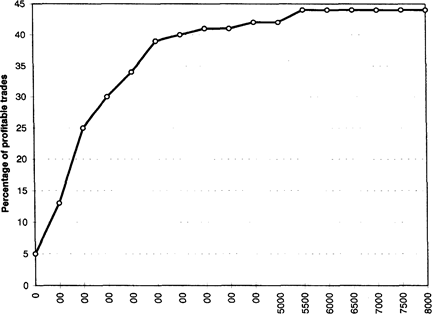
Figure 3.6 The proportion of profitable trades increases and levels off as we loosen the initial stop.
tion (Figure 3.8, page 59) shows that a stop of $3,000 exceeds 98.3 percent of all the 10-day average trading range values seen in coffee over the last 20 years. Hence, $3,000 should be a loose stop. Figures 3.3 through 3.7 show that the changes in performance begin to level off beyond $3,000. Thus, you can view stops greater than $3,000 as "very loose" stops. A $500 stop that covers less than 20 percent of all observed values of the 10-day average daily range qualifies as a "tight" stop.
You can now use the cumulative frequency distribution to select a stop based on market volatility. An arbitrary stop may be too tight or too loose. This analysis assumes that you use the same dollar stop on every trade. If you vary the initial stop on every trade then this analysis will be of little use to you. We already know that stops are hit more frequently during trading range markets. Hence, you could use some measure of trendiness to vary your initial stop.
Many traders feel an aversion to taking a big loss, even though they have no problem taking many small ones. The maximum drawdown usually decreases as the stop increases (see Figure 3.4). Thus, you should
58 Foundations of System Design