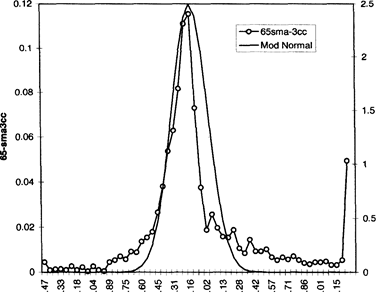
Frequency distribution of 65sma-3cc trades compared to a modified normal distribution
^-•-•^-T-OOOOOOOOOOOOOT-'-
Z (standard deviations)
Figure 4.8 A fitted normal distribution shows that the 65sma-3cc trade distribution has "fat" tails, and falls off more quickly for small positive trades.
The modified normal distribution fits the observed curve nicely on the losing side, but the small positive trades fall off sharply. This implies that you will not get very many small positive trades with a trend-following model. Small trades will occur during broad consolidations, and these are not very common. Small losing trades are more likely during consolidations, as shown by the good fit on the left side of the peak.
The huge spike at the right-hand edge of the Figure 4.6 represents the 4 percent or so of mega-trades that make trend following worthwhile. The distribution shows you it is easy to miss these trades, and if you do, your portfolio performance will drop off quickly. You should try to develop such a frequency distribution curve for your own systems to get a better feel for model performance.
A closer look at losing trades reveals another weakness of the 65sma-3cc system. Figure 4.9 is a distribution of the maximum profit of each of the 1,565 trades that were closed out at a loss, called the maximum favorable excursion (MFE). The glaring weakness is that because there is no specific exit strategy, many trades with profits greater than
86 Developing New Trading Systems