Identifying Extraordinary Opportunities
Once or twice a year, the futures markets provide extraordinary opportunities for exceptional profits, and if you can take advantage of these opportunities, your account performance will improve significantly. Ideally, you should try to increase position size in markets that present extraordinary opportunities. You can use a fixed formula or discretion in arriving at the increased exposure.
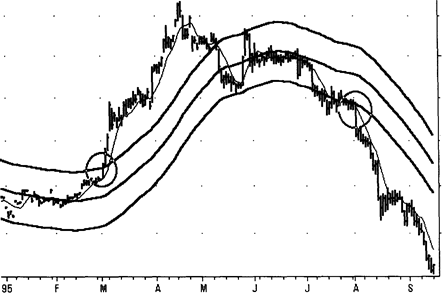
Figure 4.45 of the September 1995, Japanese yen contract illustrates such an extraordinary opportunity. If you had tripled your expo-
Identifying Extraordinary Opportunities141
sure to the Japanese yen during these two awesome moves, you would have made an extra $40,000 with only moderate extra risk. These are the situations when you need "the courage to be a pig," as one famous money manager has said.
The challenge for system design is to find a consistent definition of an extraordinary opportunity. Once you have a consistent definition, you can use it any way you wish. In particular, you can use discretionary trading to adjust your exposure to the markets to exploit these situations.
The definition of an extraordinary opportunity as used here is simple. Use a 50-day SMA and plot a 3-percent trading band around it. Then a 7-day SMA must cross outside the upper or lower band to complete the identification of extraordinary markets. Thus, if the 7-day SMA. crosses above the upper 3-percent band, an upside extraordinary situation is declared (see Figure 4.45). A converse definition is applicable for bearish markets. The best scenario is that the market follows through vigorously in the direction of the established trend. The worst scenario is that the market teases you for a day or two before returning into a congestion zone. Then use an initial stop to close out the trade.
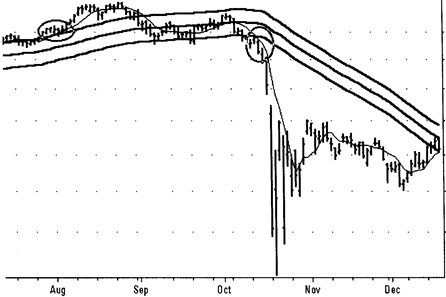
Be aware that a market can signal good opportunities for long and short trades within a few months. Some times a short-lived long signal can be a prelude to a strong down move, as the S&P-500 did in 1987
| -125.00 |
| 120.00 |
| -115.00 |
| -110.00 |
| -106.00 |
| -100.00 |

Figure 4.45 Extraordinary market opportunity identified by the 7-day SMA crossing beyond the 3 percent band around the 50-day SMA.
Developing New Trading Systems
(Figure 4.46). Hence, be alert when you get the signal for an extraordinary market condition.
The next major challenge is an exit strategy. A simple strategy of exiting on the close of the twentieth day in the trade works well. Another exit strategy is to close out the trade when the 7-day SMA moves back inside the trading bands. You can imagine several other exit strategies, and I encourage you to test them all.
Table 4.22 summarizes a test for the extraordinary opportunity idea on all available data for several markets from January 1, 1975, through June 30, 1995. These calculations combined the usual 20-day channel breakout with the rules for declaring an extraordinary market opportunity. The long entry rule requires that the 7-day SMA be beyond 1.03 times the 50-day SMA in order to purchase just above the highest high of the last 20 days. The opposite conditions are needed for the short trades. The exit was on the close of the twientieth day, and as usual, a $3,000 stop and $100 for slippage and commissions were used, to allow for a more accurate test.
The long test period (20 years in some cases), the wide diversity of markets, and the relatively high proportion of winning trades suggests this strategy is a valid approach toward identifying extraordinary market opportunities. The MIDD numbers suggest that the exit strategy is
| -320.00 -300.00 -280.00 -260.00 -240.00 -220.00 -200.00 |

Figure 4.46 A market can signal extraordinary opportunities on the long and short side within a short period.
Identifying Extraordinary Opportunities143
Table 4.22 Performance summary with 3-percent trading band, exit on close of twientieth day in trade
| Market | Profit (S) | Winners; Total Trades | Percentage of Winners | Ratio: Average Win/ Loss | Profit Factor | Maximum Intraday Drawdown (S) |
| British pound | 38,125 | 37; 62 | 1.08 | 1.60 | -11,756 | |
| Coffee | 122,273 | 69;157 | 1.94 | 1.52 | -34,683 | |
| Cotton | 48,255 | 66; 123 | 1.33 | 1.55 | -11,505 | |
| Crude oil | 12,610 | 40; 73 | 1.08 | 1.31 | -7,800 | |
| Deutsche | 9,963 | 36; 71 | 1.15 | 1.19 | -10,688 | |
| mark | ||||||
| Gold | 46,310 | 42; 85 | 1.75 | 1.71 | -21,520 | |
| Heating oil | 19,220 | 59; 117 | 1.18 | 1.20 | -17,822 | |
| Japanese yen | 18,225 | 34; 71 | 1.42 | 1.31 | -16,638 | |
| Live hogs | 10,805 | 82;149 | 0.94 | 1.15 | -11,832 | |
| Soybeans | 25,756 | 49; 107 | 1.50 | 1.26 | -25,675 | |
| S&P-500 | 28,040 | 22; 58 | 2.08 | 1.27 | -27,932 | |
| Swiss Franc | 19,187 | 44; 85 | 1.14 | 1.22 | -15,050 | |
| 10-year | 3,918 | 88; 18 | 1.53 | 1.23 | -7,506 | |
| T-Note | ||||||
| U.S. bond | 3,468 | 34; 65 | 0.89 | 1.04 | -27,932 | |
| Average | 29,011 | 1.36 | 1.33 | -17,739 |
critical to the success of this system. As an example, the results of adding a trailing stop and narrowing the bands are shown in Table 4.2 3.
In our discussion of risk of ruin, we assumed the following constant parameters: probability of winning, payoff ratio, and fraction committed to trading. However, in actual trading, the probability of winning and payoff ratio change with time. Hence, you should consider changing your fraction of capital risked on a trade, especially if an extraordinary market opportunity is recognized.
The test results in this chapter are with just one contract; this is an opportunity to use discretion and increase your exposure to the markets. Hence, the potential impact on returns can be quite significant with multiple contracts, based on the one-contract results shown here. You also have the option of using discretionary exits, or other exits based on shorter term data, such as an hourly chart.
Remember that you can check fundamental developments to confirm the presence of extraordinary market conditions. For example, there may be an unusual weather pattern, a political development, or a